1. Tips
These are some tips for the data scientist practioner.
1.1. Control ticks
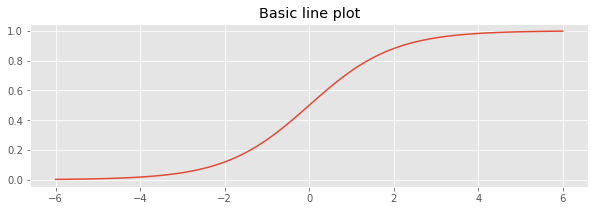
It might be annoying that the default x- and y-axis tick labels are coarsed grained. Take the example below; the x- and y-axis ticks are even numbered. What if we want more granularity and also show all whole numbers?
[1]:
from scipy.special import expit as logistic
import numpy as np
import pandas as pd
import matplotlib.pyplot as plt

np.random.seed(37)
plt.style.use('ggplot')

x = np.arange(-6, 6.1, 0.1)
y = logistic(x)
s = pd.Series(y, x)

fig, ax = plt.subplots(figsize=(10, 3))

_ = s.plot.line(x, y, ax=ax)
_ = ax.set_title('Basic line plot')
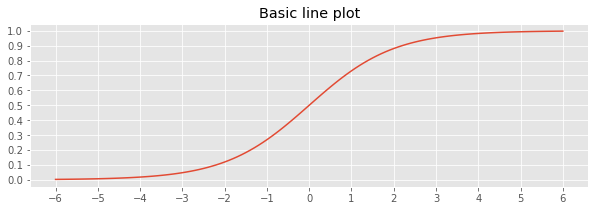
Use the set_xticks() and set_yticks() functions to control the ticks on the x- and y-axis.
[2]:
fig, ax = plt.subplots(figsize=(10, 3))

_ = s.plot.line(x, y, ax=ax)
_ = ax.set_title('Basic line plot')
_ = ax.set_xticks(np.arange(-6, 6.1, 1))
_ = ax.set_yticks(np.arange(0, 1.1, 0.1))
1.2. Multi-class, average precision score
In multi-class classification, your y_true (truth labels) might be a 1-dimensional vector, but your predictions y_pred (especially if you use predict_proba()) will be multi-dimensional. The average_precision_score(y_true, y_pred) expects that both y_true and y_pred are multi-dimensional. For example, the following will fail.
y_true = [1, 1, 0, 0, 2, 2]
y_pred = [
    [0.0, 1.0, 0.0],
    [0.0, 1.0, 0.0],
    [1.0, 0.0, 0.0],
    [1.0, 0.0, 0.0],
    [0.0, 0.0, 1.0],
    [0.0, 0.0, 1.0]
]
average_precision_score(y_true, y_pred) # fails
You will need to one-hot encode y_true.
[3]:
from sklearn.preprocessing import OneHotEncoder
from sklearn.metrics import average_precision_score

y_true = np.array([1, 1, 0, 0, 2, 2])

encoder = OneHotEncoder()
Y = encoder.fit_transform(y_true.reshape(-1, 1)).toarray()

y_pred = np.array([
    [0.0, 1.0, 0.0],
    [0.0, 1.0, 0.0],
    [1.0, 0.0, 0.0],
    [1.0, 0.0, 0.0],
    [0.0, 0.0, 1.0],
    [0.0, 0.0, 1.0]
])

average_precision_score(Y, y_pred)
/home/super/anaconda3/lib/python3.8/site-packages/sklearn/utils/validation.py:593: FutureWarning: np.matrix usage is deprecated in 1.0 and will raise a TypeError in 1.2. Please convert to a numpy array with np.asarray. For more information see: https://numpy.org/doc/stable/reference/generated/numpy.matrix.html
  warnings.warn(
[3]:
1.0
1.3. Sorting multi-index
You might have a dataframe that has multi-index for the rows and columns. How do you sort by columns or rows?
[4]:
df = pd.DataFrame({
    'height': ['tall', 'tall', 'tall', 'tall', 'short', 'short', 'short', 'short'],
    'weight': ['heavy', 'heavy', 'light', 'light', 'heavy', 'heavy', 'light', 'light'],
    'value': [9.9, 10.0, 7.7, 6.7, 5.5, 6.6, 3.3, 2.3]
})

stats = df.groupby(['height', 'weight']).agg(['mean', 'std'])
stats
[4]:
| value | |||
|---|---|---|---|
| mean | std | ||
| height | weight | ||
| short | heavy | 6.05 | 0.777817 |
| light | 2.80 | 0.707107 | |
| tall | heavy | 9.95 | 0.070711 |
| light | 7.20 | 0.707107 | |
To sort based on column multi-index, you have to use sort_values() and supply a list of tuples. Below, we will sort by the mean and then std columns.
[5]:
stats.sort_values([('value', 'mean'), ('value', 'std')])
[5]:
| value | |||
|---|---|---|---|
| mean | std | ||
| height | weight | ||
| short | light | 2.80 | 0.707107 |
| heavy | 6.05 | 0.777817 | |
| tall | light | 7.20 | 0.707107 |
| heavy | 9.95 | 0.070711 | |
To sort based on the row multi-index, it is not as complicated, simply supply a list of index names to sort_values().
[6]:
stats.sort_values(['weight'], axis=0)
[6]:
| value | |||
|---|---|---|---|
| mean | std | ||
| height | weight | ||
| short | heavy | 6.05 | 0.777817 |
| tall | heavy | 9.95 | 0.070711 |
| short | light | 2.80 | 0.707107 |
| tall | light | 7.20 | 0.707107 |
If you need to sort descendingly, pass in ascending=False.
[7]:
stats.sort_values(['weight'], axis=0, ascending=False)
[7]:
| value | |||
|---|---|---|---|
| mean | std | ||
| height | weight | ||
| short | light | 2.80 | 0.707107 |
| tall | light | 7.20 | 0.707107 |
| short | heavy | 6.05 | 0.777817 |
| tall | heavy | 9.95 | 0.070711 |
1.4. One-Hot Encoding Pipeline
When you use OHE in a pipeline, you will have to deal with missing values. If you use SimpleImputer and fill missing values with a constant value, you will always end up with an extra column. What’s worse, the columns corresponding to the categorical values will NOT be missing and instead have 0’s. Additionally, your output is a matrix, and you lose the field names. Here’s an example dataframe with 2 numeric field (height and age) and 2 categorical fields (pet and color).
[8]:
df = pd.DataFrame({
    'height': [2.3, 3.3, 2.4, 5.5, np.nan],
    'pet': ['cat', 'dog', 'cat', np.nan, 'dog'],
    'color': ['blue', 'black', np.nan, 'brown', 'black'],
    'age': [10, 5, np.nan, 4, 8]
})

df
[8]:
| height | pet | color | age | |
|---|---|---|---|---|
| 0 | 2.3 | cat | blue | 10.0 |
| 1 | 3.3 | dog | black | 5.0 |
| 2 | 2.4 | cat | NaN | NaN |
| 3 | 5.5 | NaN | brown | 4.0 |
| 4 | NaN | dog | black | 8.0 |
Let’s say we want to OHE the pet and color fields. See the problems here?
What happened to the headers?
The output is a matrix and not a dataframe.
We have an additional column.
[9]:
from sklearn.impute import SimpleImputer
from imblearn.pipeline import Pipeline
from sklearn.preprocessing import OneHotEncoder
from sklearn.compose import ColumnTransformer

MISSING_TOKEN = '__missing__'

cat_pipeline = Pipeline(steps=[
    ('imputer', SimpleImputer(strategy='constant', fill_value=MISSING_TOKEN)),
    ('ohe', OneHotEncoder(handle_unknown='ignore', sparse_output=False))
])
transformer = ColumnTransformer(transformers=[('cat', cat_pipeline, ['pet', 'color'])])

pipeline = Pipeline(steps=[
    ('preprocessing', transformer)
])

pipeline.fit_transform(df)
[9]:
array([[1., 0., 0., 0., 1., 0., 0.],
       [0., 1., 0., 1., 0., 0., 0.],
       [1., 0., 0., 0., 0., 0., 1.],
       [0., 0., 1., 0., 0., 1., 0.],
       [0., 1., 0., 1., 0., 0., 0.]])
We can try to recover the field names as follows. If we specified for the transformer to passthrough (eg remainder='passthrough' the numeric fields, then we have to do even more work to align the field names. It should be apparent that the _nan fields are a nuisance and the generic field prefixes of x0_ and x1_ are not very helpful.
[10]:
columns = transformer.named_transformers_['cat'] \
            .named_steps['ohe'] \
            .get_feature_names_out()
pd.DataFrame(pipeline.transform(df), columns=columns)
[10]:
| x0_cat | x0_dog | x0_nan | x1_black | x1_blue | x1_brown | x1_nan | |
|---|---|---|---|---|---|---|---|
| 0 | 1.0 | 0.0 | 0.0 | 0.0 | 1.0 | 0.0 | 0.0 |
| 1 | 0.0 | 1.0 | 0.0 | 1.0 | 0.0 | 0.0 | 0.0 |
| 2 | 1.0 | 0.0 | 0.0 | 0.0 | 0.0 | 0.0 | 1.0 |
| 3 | 0.0 | 0.0 | 1.0 | 0.0 | 0.0 | 1.0 | 0.0 |
| 4 | 0.0 | 1.0 | 0.0 | 1.0 | 0.0 | 0.0 | 0.0 |
So, what can we do? We can create a custom transformer to fix the problem. Take note of the pattern below. The OheAdjustmentTransformer is the custom transformer that takes in the ColumnTransformer; the former needs the latter to retrieve the OHE fields. Also, notice the dizzying nested structures of
pipelines within pipelines,
transformers within pipelines, and
pipelines within transformers.
The final output is a little bit better since
the field names are more meaningful (they have the original field names as prefixes instead of
x0_),the
_nancolumns are dropped,the records for which there should be missing values instead of 0’s are corrected, and
if we choose to pass through the numeric fields, then they are also available.
[11]:
MISSING_TOKEN = '__missing__'

class OheAdjustmentTransformer:
    def __init__(self, transformer, num_columns, cat_columns, missing_suffix=MISSING_TOKEN):
        self.transformer = transformer
        self.num_columns = num_columns
        self.cat_columns = cat_columns
        self.missing_suffix = missing_suffix

    def adjust(self, df):
        def make_null(d, cat_field, nan_field):
            n_df = pd.DataFrame()
            for field in d.columns:
                if field == nan_field:
                    continue
                u_index = field.find('_')
                val = field[u_index+1:]
                n_field = f'{cat_field}_{val}'
                n_df[n_field] = np.select([d[nan_field]==1], [np.nan], default=d[field])

            n_df.index = d.index
            return n_df

        prefixes = [f'x{i}_' for i in range(len(self.cat_columns))]
        c2n = {c: f'{p}{self.missing_suffix}' for c, p in zip(self.cat_columns, prefixes)}
        df_cols = {c: [f for f in df.columns if f.startswith(p)]
                   for c, p in zip(self.cat_columns, prefixes)}
        dfs = {c: df[df_cols[c]] for c in df_cols}
        n_dfs = {c: make_null(d, c, c2n[c]) for c, d in dfs.items()}
        f_df = pd.concat([d for d in n_dfs.values()], axis=1)

        return f_df

    def fit(self, X=None, y=None):
        return self

    def transform(self, X):
        cat_columns = self.transformer.named_transformers_['cat'] \
            .named_steps['ohe'] \
            .get_feature_names_out()
        cat_columns = list(cat_columns)
        num_columns = self.num_columns

        if X.shape[1] == len(cat_columns):
            columns = cat_columns
        else:
            columns = cat_columns + num_columns

        df = pd.DataFrame(X, columns=columns)

        if X.shape[1] == len(cat_columns):
            return self.adjust(df)
        else:
            return self.adjust(df).join(df[num_columns])

cat_columns = ['pet', 'color']
num_columns = [c for c in df.columns if c not in cat_columns]

cat_pipeline = Pipeline(steps=[
    ('imputer', SimpleImputer(strategy='constant', fill_value=MISSING_TOKEN)),
    ('ohe', OneHotEncoder(handle_unknown='ignore', sparse_output=False))
])

transformer = ColumnTransformer(
    transformers=[('cat', cat_pipeline, cat_columns)],
    remainder='passthrough')

df_pipeline = Pipeline(steps=[
    ('df', OheAdjustmentTransformer(transformer, num_columns, cat_columns))
])

pipeline = Pipeline(steps=[
    ('preprocessing', transformer),
    ('postprocessing', df_pipeline)
])

pipeline.fit_transform(df)
[11]:
| pet_cat | pet_dog | color_black | color_blue | color_brown | height | age | |
|---|---|---|---|---|---|---|---|
| 0 | 1.0 | 0.0 | 0.0 | 1.0 | 0.0 | 2.3 | 10.0 |
| 1 | 0.0 | 1.0 | 1.0 | 0.0 | 0.0 | 3.3 | 5.0 |
| 2 | 1.0 | 0.0 | NaN | NaN | NaN | 2.4 | NaN |
| 3 | NaN | NaN | 0.0 | 0.0 | 1.0 | 5.5 | 4.0 |
| 4 | 0.0 | 1.0 | 1.0 | 0.0 | 0.0 | NaN | 8.0 |
1.5. Frequency Encoding
Frequency encoding is a way to turn categorial variables into numeric ones without expanding the dimensionality of the data (as in the case of one-hot encoding). Every categorical value is replaced either with its count or probability. Here’s how to implement frequency encoding with Scikit-Learn. Other implementations are available but break with missing values. This approach here does not. First, let’s create sample data.
[12]:
df = pd.DataFrame({
    'x1': [1, 2, 3, 4, np.nan, 6],
    'x2': ['cat', 'dog', 'cat', 'cat', 'dog', np.nan],
    'y': [1, 3, 4, 5, 2, 6]
})

df
[12]:
| x1 | x2 | y | |
|---|---|---|---|
| 0 | 1.0 | cat | 1 |
| 1 | 2.0 | dog | 3 |
| 2 | 3.0 | cat | 4 |
| 3 | 4.0 | cat | 5 |
| 4 | NaN | dog | 2 |
| 5 | 6.0 | NaN | 6 |
The frequency encoder is implemented as follows. This implementation will handle with the input X is either a Pandas data frame or numpy array.
[13]:
class FreqEncoder:
    def __init__(self, variables):
        self.variables_ = variables
        self.v2e_ = None
        self.e2v_ = None

    def fit(self, X=None, y=None):
        def get_df_freq(c):
            return X[c].value_counts() / X[c].value_counts().sum()

        def get_np_freq(i):
            s = pd.Series(X[:,i]).value_counts()
            return s / s.sum()

        if isinstance(X, pd.DataFrame):
            self.v2e_ = {c: get_df_freq(c).to_dict() for c in self.variables_}
            self.e2v_ = {c: {val: key for key, val in d.items()} for c, d in self.v2e_.items()}
        elif isinstance(X, np.ndarray):
            self.v2e_ = {i: get_np_freq(i).to_dict() for i in self.variables_}
            self.e2v_ = {i: {val: key for key, val in d.items()} for i, d in self.v2e_.items()}
        else:
            raise Exception(f'X type is not handled: {type(X)}')

        return self

    def transform(self, X):
        if isinstance(X, pd.DataFrame):
            return X.assign(**{c: lambda d: d[c].map(self.v2e_[c]) for c in self.variables_})
        elif isinstance(X, np.ndarray):
            df = pd.DataFrame(X, columns=[f'{i}' for i in range(X.shape[1])])
            df = df.assign(**{f'{i}': lambda d: d[f'{i}'].map(self.v2e_[i]) for i in self.variables_})
            return df.values
        else:
            raise Exception(f'X type is not handled: {type(X)}')

    def inverse_transform(self, X):
        if isinstance(X, pd.DataFrame):
            return X.assign(**{c: lambda d: d[c].map(self.e2v_[c]) for c in self.variables_})
        elif isinstance(X, np.ndarray):
            df = pd.DataFrame(X, columns=[f'{i}' for i in range(X.shape[1])])
            df = df.assign(**{f'{i}': lambda d: d[f'{i}'].map(self.e2v_[i]) for i in self.variables_})
            return df.values
        else:
            raise Exception(f'X type is not handled: {type(X)}')
Now, let’s use the encoder and inspect its properties. The v2e_ field is the forward mapping of categorial variable values to frequencies and the e2v_ field is the inverse/backward mapping of frequencies to categorial variable values. Obviously, a concern is with ties (we leave it up to the user to add a random fudge factor and renormalize to fix this problem).
[14]:
encoder = FreqEncoder(list(df.select_dtypes(include=['object']).columns))
encoder.fit(df)

encoder.v2e_, encoder.e2v_
[14]:
({'x2': {'cat': 0.6, 'dog': 0.4}}, {'x2': {0.6: 'cat', 0.4: 'dog'}})
Here is the transform.
[15]:
encoder.transform(df)
[15]:
| x1 | x2 | y | |
|---|---|---|---|
| 0 | 1.0 | 0.6 | 1 |
| 1 | 2.0 | 0.4 | 3 |
| 2 | 3.0 | 0.6 | 4 |
| 3 | 4.0 | 0.6 | 5 |
| 4 | NaN | 0.4 | 2 |
| 5 | 6.0 | NaN | 6 |
Here is the inverse transform.
[16]:
encoder.inverse_transform(encoder.transform(df))
[16]:
| x1 | x2 | y | |
|---|---|---|---|
| 0 | 1.0 | cat | 1 |
| 1 | 2.0 | dog | 3 |
| 2 | 3.0 | cat | 4 |
| 3 | 4.0 | cat | 5 |
| 4 | NaN | dog | 2 |
| 5 | 6.0 | NaN | 6 |
Let’s use the encoder in a pipeline.
[17]:
from sklearn.linear_model import LinearRegression

X, y = df[['x1', 'x2']], df['y']

model = Pipeline([
    ('encoder', FreqEncoder(['x2'])),
    ('imputer', SimpleImputer()),
    ('estimator', LinearRegression())
])

model.fit(X, y)
model.predict(X)
[17]:
array([1.70620043, 1.89185292, 3.61679885, 4.57209805, 3.03821197,
       6.17483778])
We may access the fitted encoder from the pipeline.
[18]:
model.steps[0][1].transform(X)
[18]:
| x1 | x2 | |
|---|---|---|
| 0 | 1.0 | 0.6 |
| 1 | 2.0 | 0.4 |
| 2 | 3.0 | 0.6 |
| 3 | 4.0 | 0.6 |
| 4 | NaN | 0.4 |
| 5 | 6.0 | NaN |
And we can see the fitted encoder in the pipeline at action with inverse transformation.
[19]:
model.steps[0][1].inverse_transform(model.steps[0][1].transform(X))
[19]:
| x1 | x2 | |
|---|---|---|
| 0 | 1.0 | cat |
| 1 | 2.0 | dog |
| 2 | 3.0 | cat |
| 3 | 4.0 | cat |
| 4 | NaN | dog |
| 5 | 6.0 | NaN |
For the sake of completeness, let’s work with numpy arrays.
[20]:
X, y = df[['x1', 'x2']].values, df['y'].values
X, y
[20]:
(array([[1.0, 'cat'],
        [2.0, 'dog'],
        [3.0, 'cat'],
        [4.0, 'cat'],
        [nan, 'dog'],
        [6.0, nan]], dtype=object),
 array([1, 3, 4, 5, 2, 6]))
Notice that since we are using a numpy array for X, we cannot pass in the column names and must pass in the index of the columns that need to be frequency encoded.
[21]:
model = Pipeline([
    ('encoder', FreqEncoder([1])),
    ('imputer', SimpleImputer()),
    ('estimator', LinearRegression())
])

model.fit(X, y)
model.predict(X)
[21]:
array([1.70620043, 1.89185292, 3.61679885, 4.57209805, 3.03821197,
       6.17483778])
Here is the fitted frequency encoded model used to transform the data.
[22]:
model.steps[0][1].transform(X[:,:2])
[22]:
array([[1.0, 0.6],
       [2.0, 0.4],
       [3.0, 0.6],
       [4.0, 0.6],
       [nan, 0.4],
       [6.0, nan]], dtype=object)
Here is the fitted frequency encoded model used to inverse transform the data.
[23]:
model.steps[0][1].inverse_transform(model.steps[0][1].transform(X[:,:2]))
[23]:
array([[1.0, 'cat'],
       [2.0, 'dog'],
       [3.0, 'cat'],
       [4.0, 'cat'],
       [nan, 'dog'],
       [6.0, nan]], dtype=object)
1.6. Displaying Pandas Series and DataFrames
Often times, we want to display ALL columns and fields of a Pandas Series or DataFrame. We can set the options in a notebook cell as follows.
pd.set_option('display.max_rows', None)
pd.set_option('display.max_columns', None)
But now, these settings take over all subsequent displays. Later, when we need to revert, we can do the following.
# one at a time
pd.reset_option('display.max_rows')
pd.reset_option('display.max_columns')

# or all at once
pd.reset_option('all')
It’s better to use the Pandas option context manager to temporarily make the settings just for a cell.
with pd.option_context('display.max_rows', None, 'display.max_columns', None):
    display(some_df)
    display(some_series)