3. Heat Map
[1]:
%matplotlib inline
import matplotlib.pyplot as plt

plt.style.use('seaborn-v0_8')
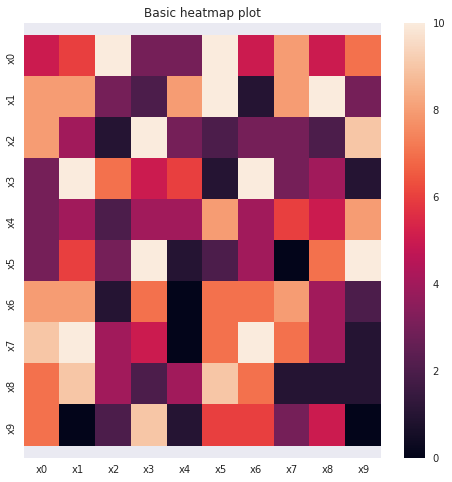
3.1. Basic
[2]:
import numpy as np
import pandas as pd
import seaborn as sns

np.random.seed(37)

n = 10
labels = [f'x{i}' for i in range(n)]
df = pd.DataFrame(np.random.randint(0, 11, size=(n, n)), index=labels, columns=labels)

fig, ax = plt.subplots(figsize=(8, 8))

_ = sns.heatmap(df)
_ = ax.set_title('Basic heatmap plot')

y_min, y_max = ax.get_ylim()
dh = 0.8
_ = ax.set_ylim(y_min + dh, y_max - dh)
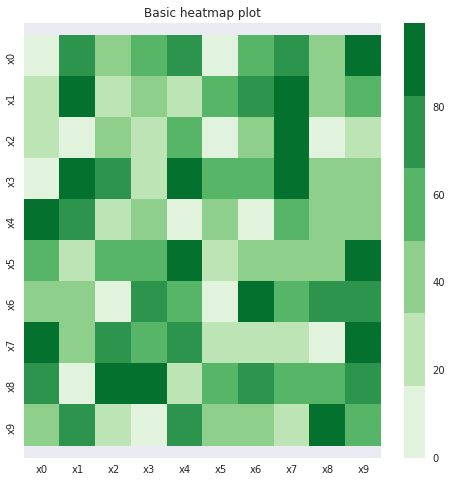
3.2. Change color map
Look at the color palettes for more ideas.
[3]:
n = 10
labels = [f'x{i}' for i in range(n)]
df = pd.DataFrame(np.random.randint(0, 100, size=(n, n)), index=labels, columns=labels)

fig, ax = plt.subplots(figsize=(8, 8))

_ = sns.heatmap(df, square=False, cmap=sns.color_palette('Greens'))
_ = ax.set_title('Basic heatmap plot')

y_min, y_max = ax.get_ylim()
dh = 0.8
_ = ax.set_ylim(y_min + dh, y_max - dh)