8. Scatter Plot
[1]:
%matplotlib inline
import matplotlib.pyplot as plt
import numpy as np
import pandas as pd
import seaborn as sns

plt.style.use('ggplot')
np.random.seed(37)
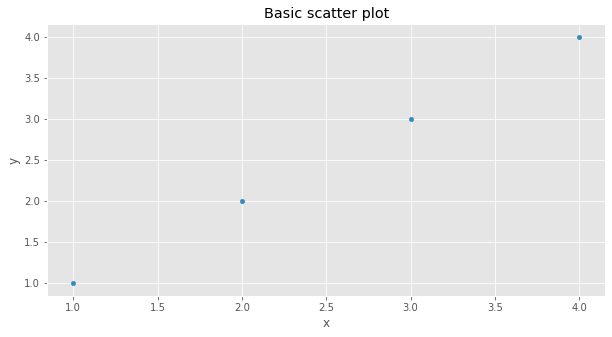
8.1. Basic
[5]:
df = pd.DataFrame({
    'x': [1, 2, 3, 4],
    'y': [1, 2, 3, 4]
})

fig, ax = plt.subplots(figsize=(10, 5))
_ = df.plot(kind='scatter', x='x', y='y', ax=ax)
_ = ax.set_title('Basic scatter plot')
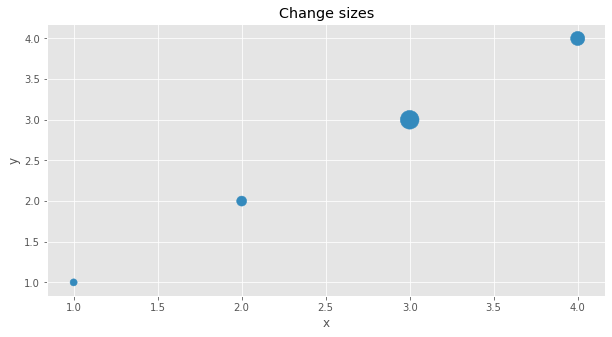
8.2. Change sizes of data points
[14]:
df = pd.DataFrame({
    'x': [1, 2, 3, 4],
    'y': [1, 2, 3, 4],
    's': [50, 100, 350, 200]
})

fig, ax = plt.subplots(figsize=(10, 5))
_ = df.plot(kind='scatter', x='x', y='y', s=df.s, ax=ax)
_ = ax.set_title('Change sizes')
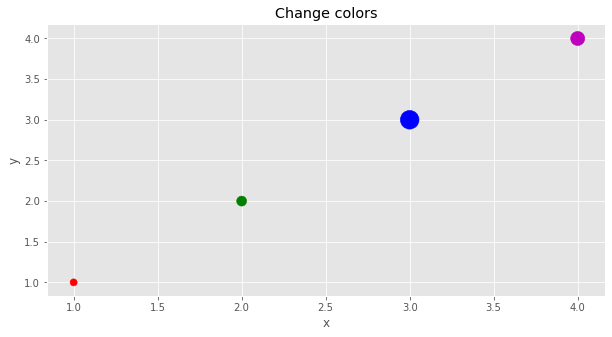
8.3. Change colors
[16]:
df = pd.DataFrame({
    'x': [1, 2, 3, 4],
    'y': [1, 2, 3, 4],
    's': [50, 100, 350, 200],
    'c': ['r', 'g', 'b', 'm']
})

fig, ax = plt.subplots(figsize=(10, 5))
_ = df.plot(kind='scatter', x='x', y='y', s=df.s, c=df.c, ax=ax)
_ = ax.set_title('Change colors')