11. Mosiac Plots
Mosiac plots are a great way to juxtapose and configure multiple plots together. Let’s see how they work.
11.1. Housing data
For this example, we will use the housing data.
[1]:
from _runtime import load_california_housing_data

X, y = load_california_housing_data(return_X_y=True, as_frame=True)
[2]:
X.shape, y.shape
[2]:
((20640, 8), (20640,))
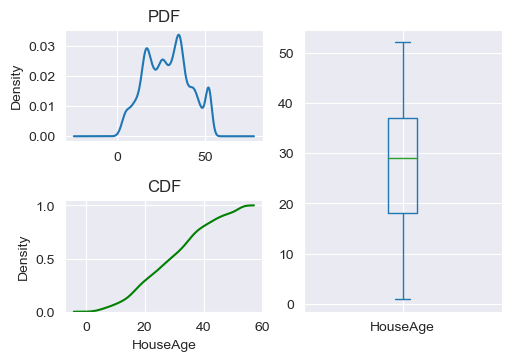
11.2. Mosiac plot by string configuration
You can configure a mosaic plot by using codes for each subplot. Here, we want 3 subplots coded a, b and c. Note how a and b take up one row and one column while c takes up two rows and one column.
[3]:
import matplotlib.pyplot as plt
import seaborn as sns

fig = plt.figure(layout='constrained', figsize=(5, 3.5))
ax = fig.subplot_mosaic('''
ac
bc
''')

X['HouseAge'].plot(kind='kde', ax=ax['a'])
sns.kdeplot(X['HouseAge'], ax=ax['b'], cumulative=True, color='g')
X['HouseAge'].plot(kind='box', ax=ax['c'])

ax['a'].set_title('PDF')
ax['b'].set_title('CDF')
[3]:
Text(0.5, 1.0, 'CDF')

11.3. Mosiac plot by list configuration
We can also define the subplots more meaningfully by using names placed into a matrix (list of list). Instead of a, b and c, we now use pdf, cdf and box, correspondingly.
[4]:
fig = plt.figure(layout='constrained', figsize=(5, 3.5))
ax = fig.subplot_mosaic([
    ['pdf', 'box'],
    ['cdf', 'box']
])

X['HouseAge'].plot(kind='kde', ax=ax['pdf'])
sns.kdeplot(X['HouseAge'], ax=ax['cdf'], cumulative=True, color='g')
X['HouseAge'].plot(kind='box', ax=ax['box'])

ax['pdf'].set_title('PDF')
ax['cdf'].set_title('CDF')
[4]:
Text(0.5, 1.0, 'CDF')
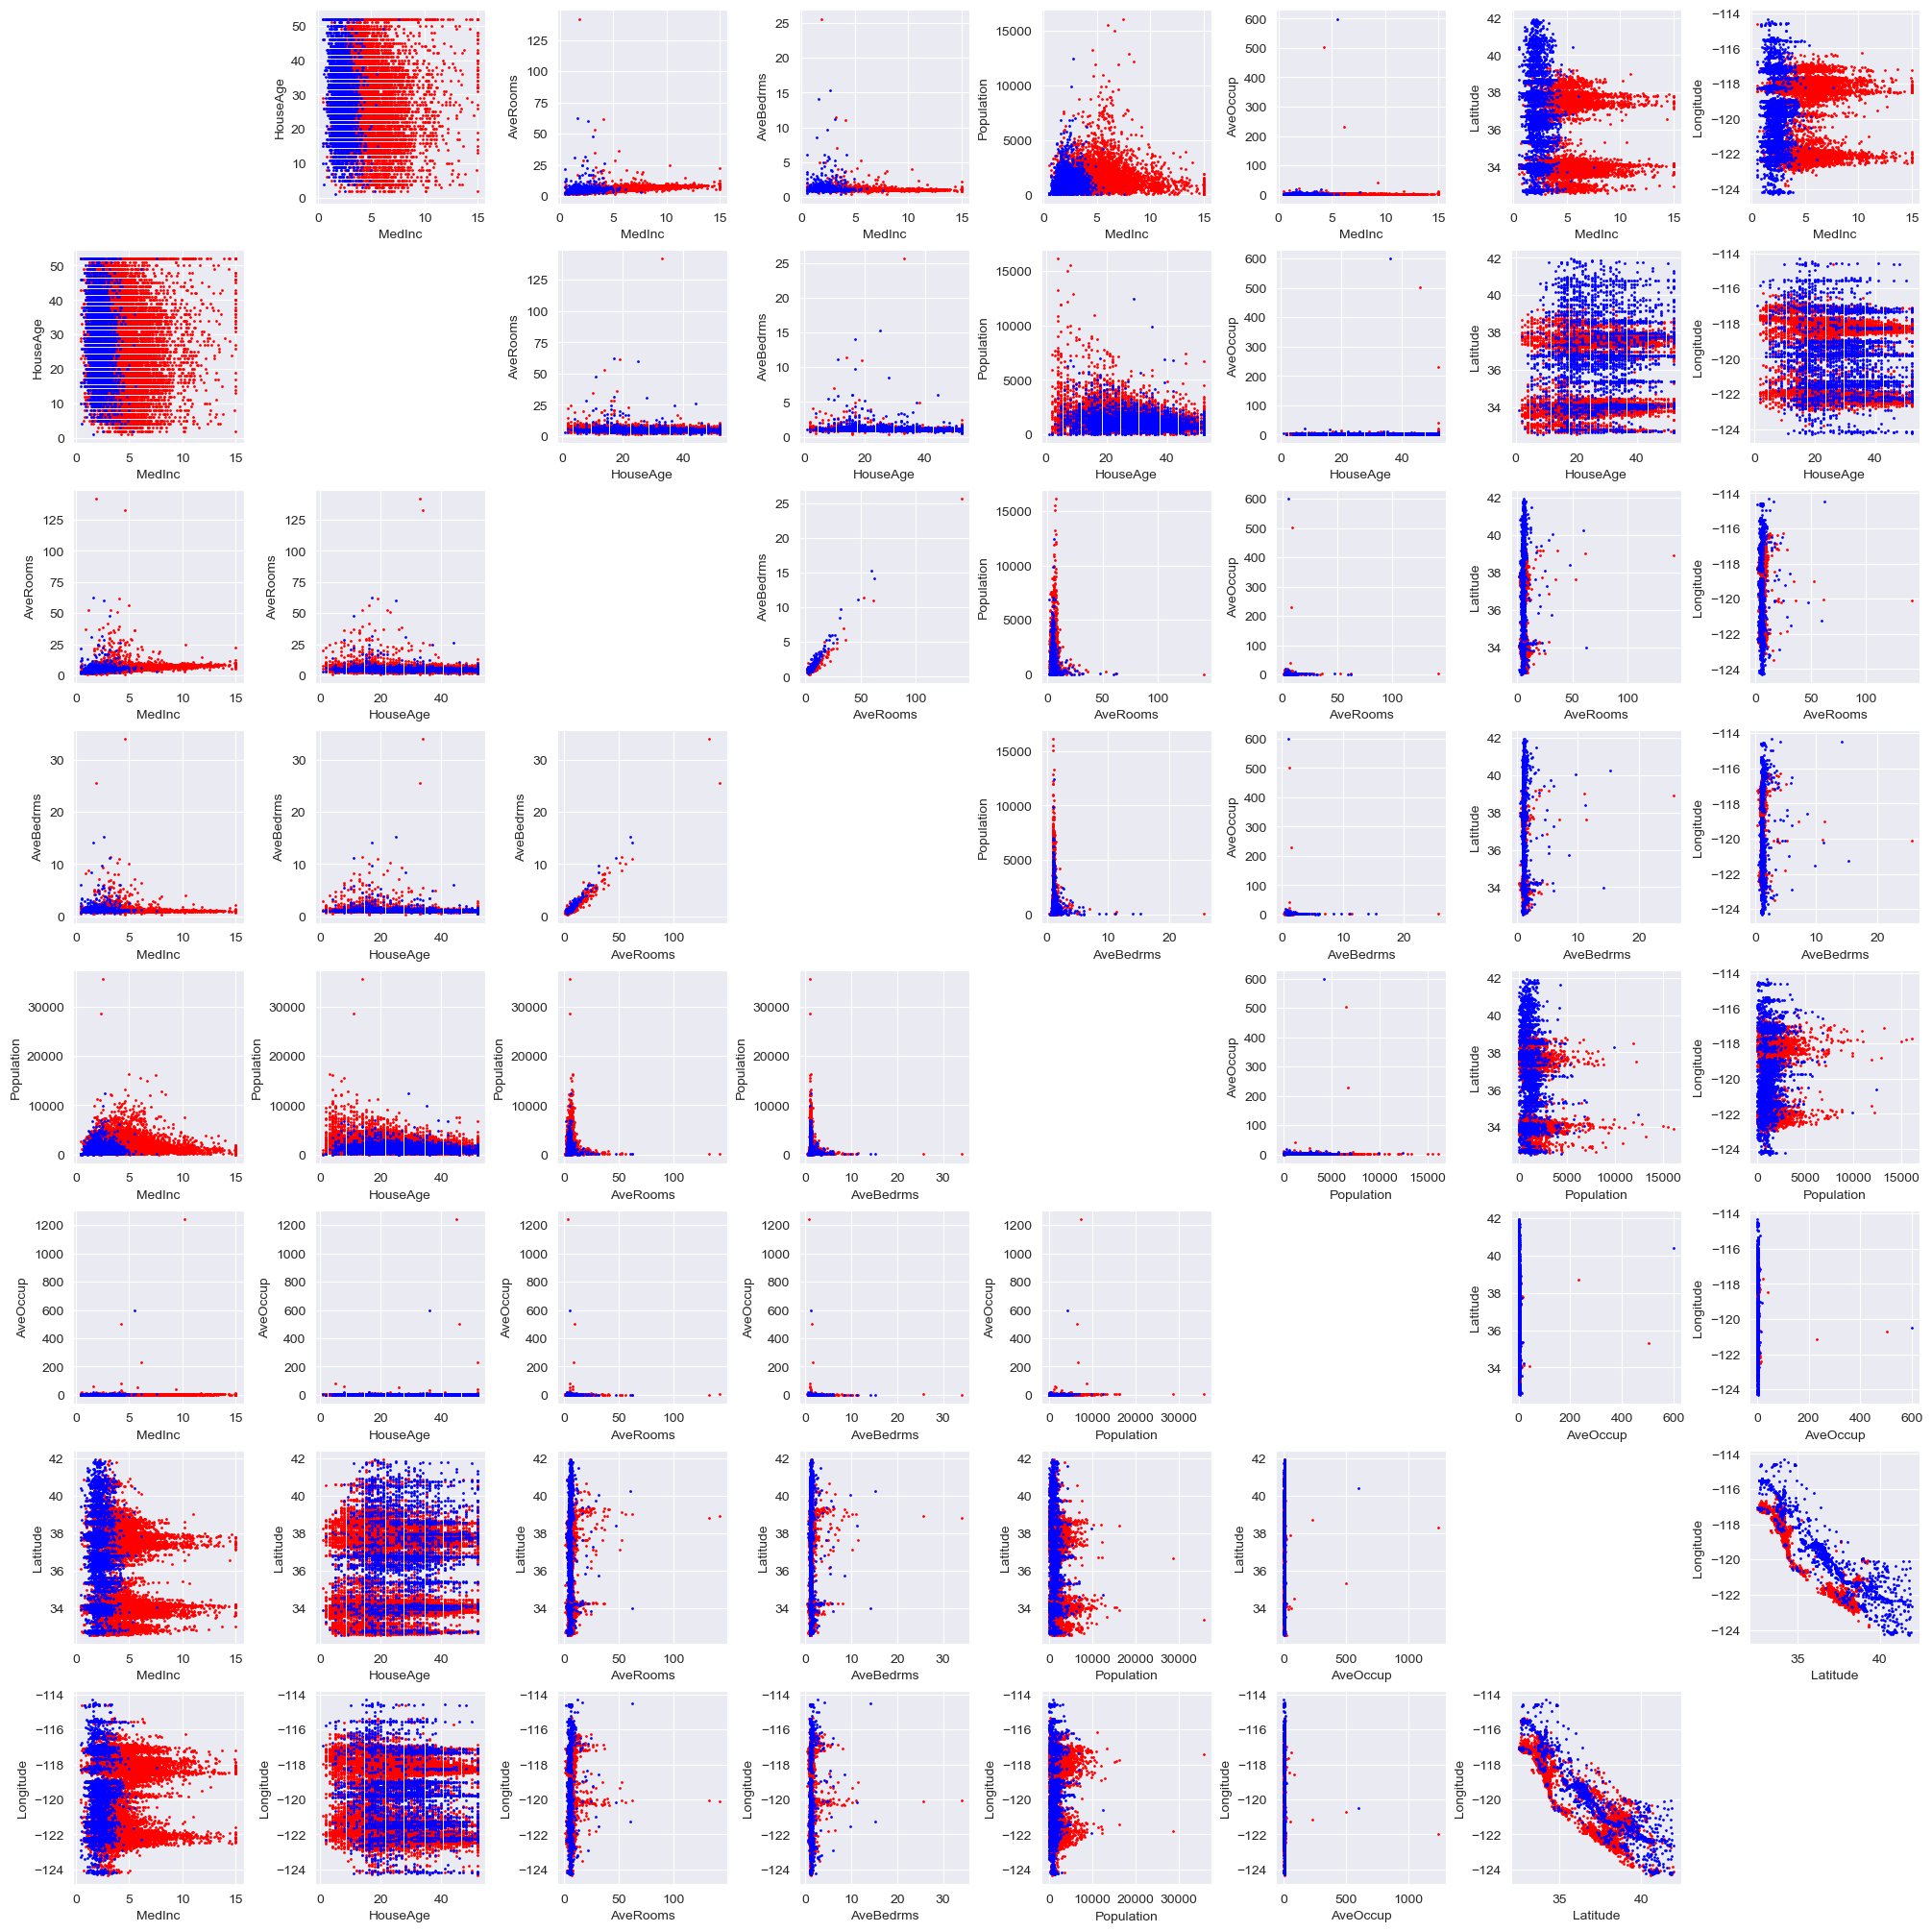
11.4. Fancy example
Here’s a fancy example of a mosaic plot where we make multiple scatter plots. The plots in the upper triangle color code the scatter plots according to y (if the corresponding y of the scatter plot point is above, red, or below, blue, the mean of y). The plots in the lower triangle color code the scatter plots according to y with a different criterion (if the corresponding y of the scatter plot point is below one standard deviation of y, blue, or not, red).
[5]:
def get_key(r, c, x_col, y_col):
    if r == c:
        return '.'
    if c < r:
        return f'{x_col}_{y_col}_lower'
    return f'{x_col}_{y_col}_upper'

def do_plot(r, c, x_col, y_col, ax):
    k = get_key(r, c, x_col, y_col)
    if '.' == k:
        return
    elif c < r:
        X[y > y.mean() - y.std()].plot(kind='scatter', y=x_col, x=y_col, ax=ax[k], s=1, color='r')
        X[y <= y.mean() - y.std()].plot(kind='scatter', y=x_col, x=y_col, ax=ax[k], s=1, color='b')
    else:
        X[y > y.mean()].plot(kind='scatter', x=x_col, y=y_col, ax=ax[k], s=1, color='r')
        X[y <= y.mean() - y.std()].plot(kind='scatter', x=x_col, y=y_col, ax=ax[k], s=1, color='b')

mosiac = [[get_key(r, c, x_col, y_col) for c, y_col in enumerate(X.columns)] for r, x_col in enumerate(X.columns)]

fig = plt.figure(layout='constrained', figsize=(20, 20))
ax = fig.subplot_mosaic(mosiac)

_ = [[do_plot(r, c, x_col, y_col, ax) for c, y_col in enumerate(X.columns)] for r, x_col in enumerate(X.columns)]
/opt/anaconda3/lib/python3.9/site-packages/pandas/plotting/_matplotlib/core.py:1114: UserWarning: No data for colormapping provided via 'c'. Parameters 'cmap' will be ignored
  scatter = ax.scatter(