5. Box Plot
[1]:
%matplotlib inline
import matplotlib.pyplot as plt
import seaborn as sns
import numpy as np
import pandas as pd

plt.style.use('ggplot')

np.random.seed(37)
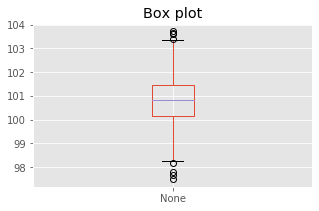
5.1. Simple box plot
[2]:
sigma = 1.0
mu = 100.8

x = sigma * np.random.randn(1000) + mu
s = pd.Series(x)

fig, ax = plt.subplots(figsize=(5, 3))

_ = s.plot(kind='box', ax=ax)
_ = ax.set_title('Box plot')
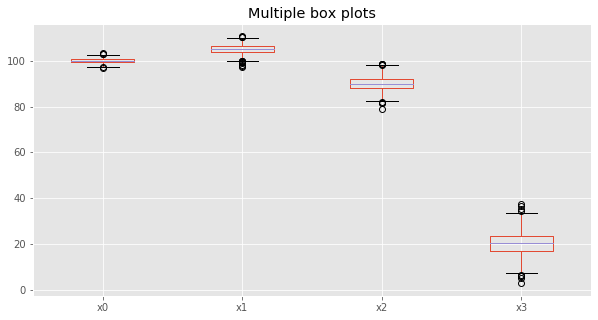
5.2. Multiple box blots
[3]:
mus = [100, 105, 90, 20]
sigmas = [1.0, 2.0, 3.0, 5.0]

df = pd.DataFrame({f'x{i}': sigma * np.random.randn(1000) + mu
                   for i, (mu, sigma) in enumerate(zip(mus, sigmas))})

fig, ax = plt.subplots(figsize=(10, 5))

_ = df.plot(kind='box', ax=ax)
_ = ax.set_title('Multiple box plots')