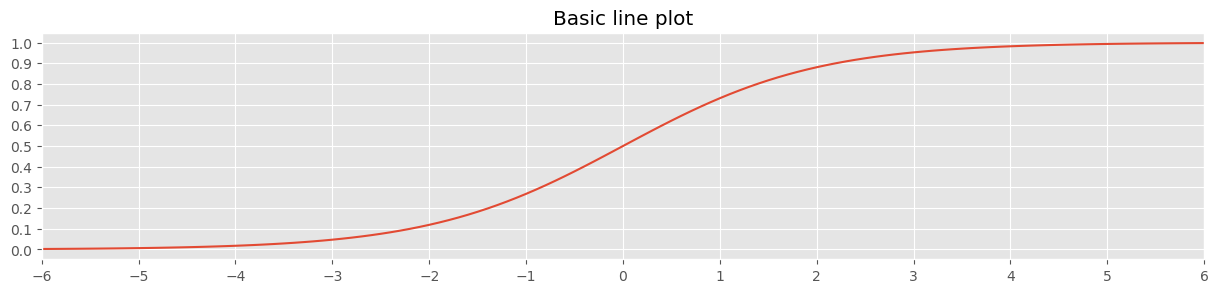
x = np.arange(-6, 6.1, 0.1)
y = logistic(x)
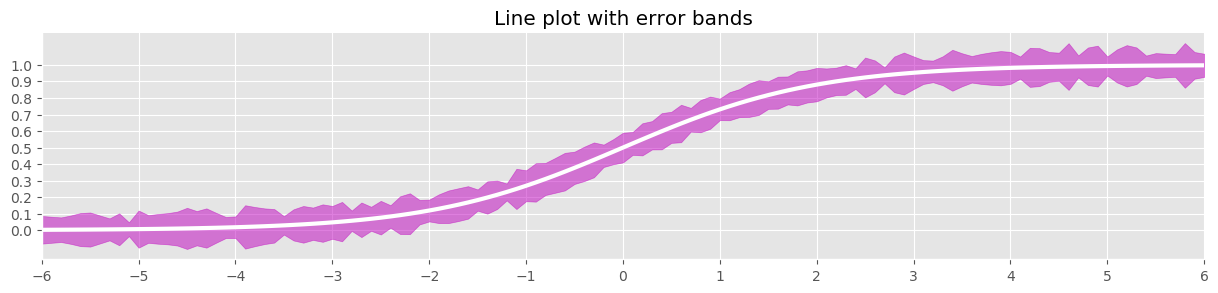
sd = (y + (0.1 * np.random.randn(10, y.shape[0]))).std(axis=0)
y_p = y + sd
y_n = y - sd
s = pd.Series(y, x)
fig, ax = plt.subplots(figsize=(15, 3), dpi=100)
_ = s.plot.line(x, y, color='w', lw='3', ax=ax)
_ = ax.fill_between(x, y_p, y_n, color='m', alpha=0.5)
_ = ax.set_title('Line plot with error bands')
_ = ax.set_xticks(np.arange(-6, 6.1, 1))
_ = ax.set_yticks(np.arange(0, 1.1, 0.1))
_ = ax.spines['top'].set_alpha(0)
_ = ax.spines['bottom'].set_alpha(1)
_ = ax.spines['right'].set_alpha(0)
_ = ax.spines['left'].set_alpha(1)